Business Intelligence Tableau Visualizations Less is more. Here is guide to develop a dashboard that make sense.
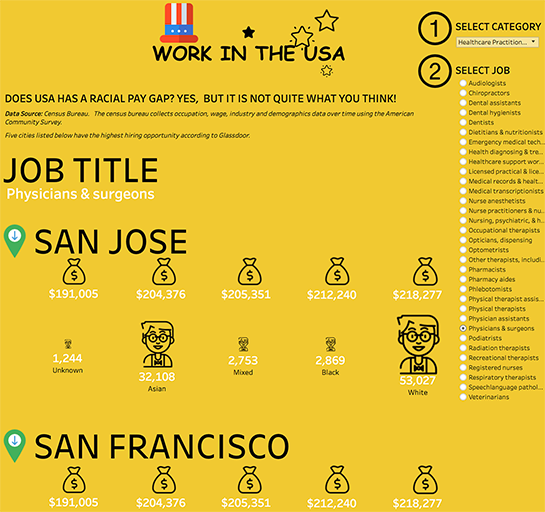
Tableau DashboardsTableau Visualization – Racial Wage Gap Our Tableau visualization visualizes racial wage gap in the top five cities with highest hiring opportunity that are San… PaintedDataJune 14, 2017
Tableau DashboardsInformation is Beautiful Data visualization is one of the most enjoyable trends in media. Here we have mapped estimated current population… PaintedDataJune 16, 2017
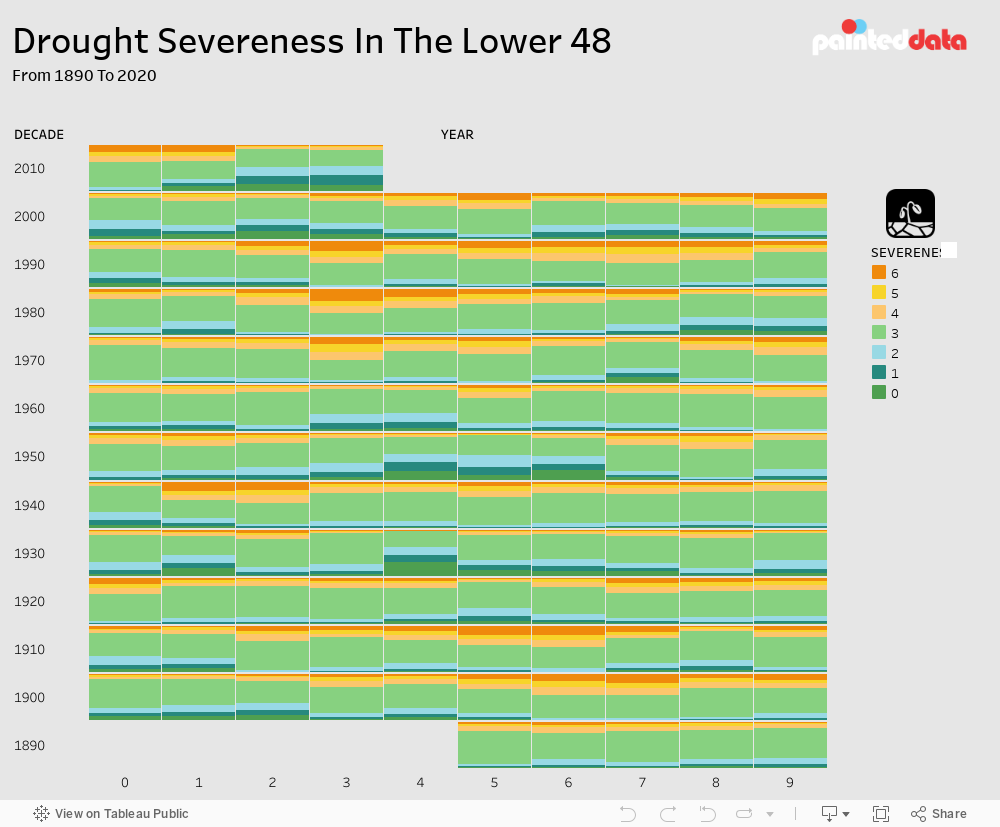
Tableau DashboardsBar chart types in Tableau Dataviz by Painted data. Are you storytelling with data? Here are some interesting collection of bar charts you can… PaintedDataMay 23, 2019