WHAT IS POWER BI ?
Microsoft Power BI for Office 365 is a cloud based collection of features and services that works from within Excel and Office 365 to analyze and visualize data in a self-service way. The BI solution is designed to help business users gain insights from their data and, according to Microsoft, includes the following:
Power Pivot. Power Pivot provides end-user accessible, in-memory data modeling for large data sets. Power Pivot was introduced as an add-in to Excel 2010, and since has been fully integrated as an out-of-the-box feature in Excel 2013.
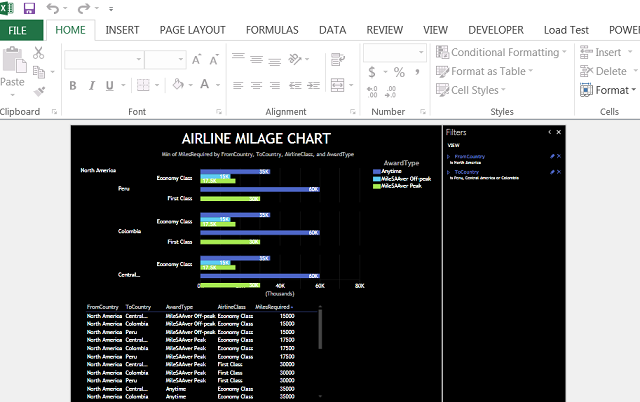
Power View. Power View is a complimentary technology to Power Pivot, enabling advanced visualizations for data models created in Power Pivot. Power View delivers interactive visualizations, including animated visuals and maps powered by Bing Maps. Originally Power View was available only as a SharePoint feature, but has since been integrated directly into Excel 2013.
Power Map. Power Map, previously known by the development name GeoFlow, is an add-in to Excel 2013 that provides still more compelling Bing Map powered visualizations, extending Power View’s capabilities with 3D map visualizations.
Mobile BI Viewer. Microsoft announced (but has not fully detailed) native mobile viewing applications for visualizations created in Power View and published to Power BI sites. The mobile components will meet the growing requirement to deliver BI visualizations to tablet devices.
Power Query. Power Query, previously known by the development name Data Explorer, is an add-in to Excel 2013 that provides a more fluid, open data discovery environment than is provided by Power Pivot alone. Despite its unexciting name, we believe Power Query, together with its catalog and on-premises data integration, will do more to enable innovative self-service BI solutions than any end-user technology we’ve seen to-date.
Data Management Gateway. While the publishing and consumption experience for Power BI is in the cloud, Microsoft has recognized that much of the underlying data users will explore will still be on premises. Power BI’s architecture includes a Data Management Gateway facility to allow users to discover, explore and incorporate on premises data within the cloud publishing infrastructure.
Q&A. Q&A is the most Exciting of all the end-user technologies announced at WPC—by far. Just as Google’s search engine fundamentally changed the way the world discovers and interacts with content on the Internet, Q&A will completely change how users discover and navigate their organization’s rapidly growing, yet often abstruse, mountain of data.
Power BI enables users to search data within their own network, or access data from public sources. Users can query in plain English and easily convert the results into interactive charts or maps to put it into context that can help guide business decisions. Power Query can merge and analyze information from multiple sources and produce results that help users make sense of the data without requiring them to be a database or big data genius. Power Pivot allows users to create analytical models and easily manipulate the results to create different “what-if” scenarios. Big Data for Little Guys? Microsoft might have provided an answer.