What is Data Visualization?
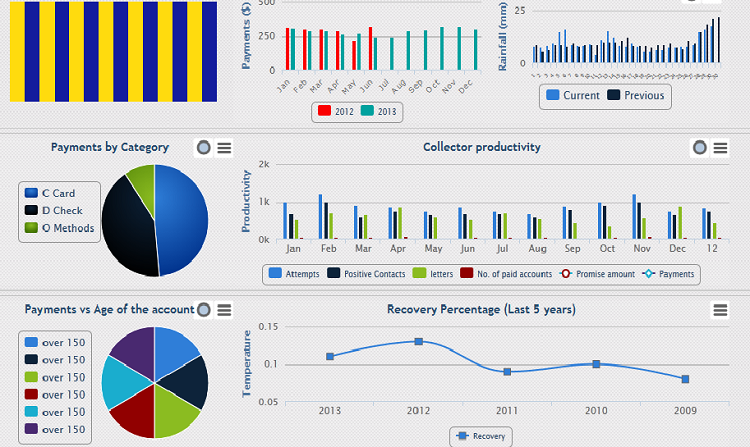
Data Visualization plays an important role in the world of Business Intelligence (BI). By efficiently identifying trends and patterns, Data Visualization helps the user quickly understand and relate to the data, without having to painstakingly sift through it.
Because of the way the human brain processes information, it is faster for people to grasp the meaning of many data points when they are displayed in charts and graphs rather than poring over piles of spreadsheets or reading pages and pages of reports.
Why is Data Visualization important?
Data Visualizations help users to see things that were not obvious to them before With Data Visualizations even when data volumes are very large, patterns can be spotted quickly and easily. Visualizations convey information in a universal manner and make it simple to share ideas with others. It lets people ask others, “Do you see what I see?” And it can even answer questions like “What would happen if we made an adjustment to that area?”
Common Data Visualization Techniques
- Understand the data you are trying to visualize, including its size and cardinality (the uniqueness of data values in a column).
- Determine what you are trying to visualize and what kind of information you want to communicate.
- Know your audience and understand how it processes visual information.
- Use a visual that conveys the information in the best and simplest form for your audience.
What is interactive Data Visualization?
Interactive data visualizations allow users to explore a data set for themselves — often by providing details on mouse over, giving different coordinated views, or panning and zooming. Quite interesting Interactive Data Visualization can be developed taking the advantage of modern web browsers.
We develop BI Solutions.